Working with Swift Data Images and Data Blob Faulting

If you are building a image-heavy SwiftUI application using Apple’s modern SwiftData framework, there is a performance trap waiting for you. It builds perfectly, looks correct in code reviews, and compiles with zero warnings.
But the moment your users drop real-world smartphone photos into it, your system memory will skyrocket, frames will drop, and the iOS kernel will eventually execute an Out-Of-Memory (OOM) crash on your application.
Let’s look under the hood at a common implementation pattern to diagnose exactly why it breaks down, and how core database mechanisms interact with the SwiftUI rendering loop.
The Baseline Implementation
Consider a standard application meant to display a grid of saved user favorites. The underlying SwiftData model uses the official @Attribute(.externalStorage) configuration to keep heavy binaries separate from the primary database file:
@Model
class FavoriteItem: Identifiable {
    var id = UUID()
    var name: String
        @Attribute(.externalStorage)
    var image: Data?
    var isFavorite: Bool = false
    init(name: String = "", image: Data?) {
        self.name = name
        self.image = image
    }
}
To display this collection, a standard three-column adaptive grid view loads the records directly using a @Query property wrapper:
@Query(sort: \FavoriteItem.name) private var items: [FavoriteItem]

struct ContentView: View {
    private let columns = Array(repeating: GridItem(.flexible(), spacing: 12), count: 3)

    var body: some View {
        NavigationStack {
            ScrollView {
                LazyVGrid(columns: columns, spacing: 12) {
                    ForEach(items) { item in
                        NavigationLink {
                            ItemDetailView(item: item)
                        } label: {
                            FavoriteItemGridCell(item: item)
                        }
                    }
                }
                .padding()
            }
            .navigationTitle("Favorite Items")
        }
    }
}
The rendering layout logic of individual items inside that viewport is split into helper child view structures:
private struct FavoriteItemGridCell: View {
    let item: FavoriteItem

    var body: some View {
        VStack {
            // This touches the Swift Data image property directly
            FavoriteItemImage(data: item.image)
                .aspectRatio(1, contentMode: .fit)
        }
        .clipShape(.circle)
    }
}

private struct FavoriteItemImage: View {
    let data: Data?

    var body: some View {
        // The Main Thread Decompression Trap
        if let data, let image = UIImage(data: data) {
            Image(uiImage: image)
                .resizable()
                .scaledToFill()
        } else {
            Image(systemName: "photo")
        }
    }
}
The Telemetry Profile: What Happens at Runtime?
When you stress-test this code using real-world assets (e.g., standard 12 Megapixel smartphone captures), Xcode Instruments reveals a massive memory footprint expansion:
On Launch (15 Items): 465 MB baseline memory footprint.
Navigation Link Evaluation: Footprint scales up to 500 MB.
Flipping a Status Flag (Toggle Event): RAM climbs to 570 MB.
For a grid rendering only 15 collection entries, this footprint is disproportionately high. An optimized thumbnail compilation pipeline should sit comfortably below 100 MB.

Technical Root Cause Analysis
Three distinct architectural architectural bottlenecks work together to cause these memory spikes.
1. Breaking the Fault Eagerly
SwiftData is built on a deferred loading technique known as faulting. When objects are retrieved from your persistent context via @Query, data properties—especially massive properties flagged with .externalStorage—are represented as lightweight pointers. The actual binary data stays on disk until explicitly accessed.
Look closely at the cell view implementation:
FavoriteItemImage(data: item.image)Because item.image is passed as an immediate input argument inside the grid's layout initialization, the database engine is forced to evaluate the property.
The moment that line is read, the fault breaks. SwiftData instantly pulls the raw byte buffers for all 15 images off the storage disk and dumps them into live system memory simultaneously at startup.
2. The Main-Thread Bitmap Explosion
A common misconception among iOS developers is that the memory cost of an image matches its size on disk.
When a 12 MP camera image is stored as a compressed HEIF or JPEG file, it might take up only 1.1 MB to 1.5 MB on disk. However, when passed into UIImage(data:) inside the synchronous view execution body of a SwiftUI layout, CoreGraphics must decompress the file container into uncompressed bitmap arrays directly on the Main Thread.
Width (3024)×Height (4032)×4 bytes per pixel ≈ 48.7 MB of RAM
Because a 3-column layout easily accommodates 12 to 15 thumbnail frames on screen simultaneously, the application attempts to decompress 15 full-sized canvas bitmaps at once on launch. SwiftUI's .resizable() and .scaledToFill() modifiers do not compress the data footprint; they simply mask the massive 48.7 MB live canvas down visually into the tiny grid container.
3. The Mutation State Loop
When navigating to a detailed pane view and manipulating a model property using a @Bindable property path:
Toggle(isOn: $item.isFavorite)Flipping this layout toggle marks the entire managed record instance as modified inside the main ModelContext.
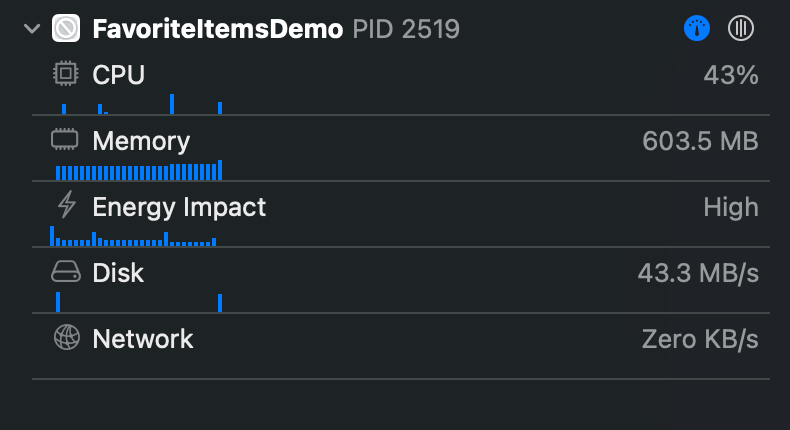
When the context triggers a save operation, SwiftUI detects data adjustments across the structural state layer and re-evaluates the active layouts tracking that specific item. Because your image loading pipeline is tied directly to the view layout evaluation context, the system re-runs UIImage(data: data) all over again, duplicating tracking allocations before previous runtime objects can clear system heap memory. Look at the Xcode Debug Navigator tab now, the memory has jumped to over 600 MB!
The Solution Blueprint
To build a high-performance, production-grade image grid layout, your application layer should decouple the core persistent data representation from visual presentation states:
Pre-Computed Storage Downsampling: Never extract full-resolution photos directly for grid selections. When a record is committed via PhotosPicker, generate a lightweight thumbnail representation (e.g., restricted to a 240px bounds layout) and store it as a separate thumbnailData attribute directly on the primary model.
Background Context Decompression: For single full-scale detail components, read the data footprint entirely off the Main Thread. Use decoupled background tasks (Task.detached) along with explicit background rendering preparation modifiers like preparingForDisplay() to offload the initial computational bitmap compression tax from your interactive UI execution tracks.
Decoupling with an Asynchronous Cache and Image Loader: Instead of binding views directly to raw database properties, route image asset requests through a dedicated image loader subsystem supported by an in-memory NSCache layer. This structural change provides major advantages:
Automatic Memory Purging (Device Protection): Unlike a standard Swift Dictionary, NSCache listens directly to iOS system memory warnings. If the device runs low on memory due to background tasks or system constraints, NSCache will automatically evict its oldest or least-recently-used (LRU) cached UIImages to prevent an Out-of-Memory (OOM) crash.
Thread Safety Built-In: NSCache is completely thread-safe by default. You can confidently write to it from background workers (like a detached Task unzipping a downsampled thumbnail) and read from it directly on the Main Thread without manually implementing locks or dispatch queues to prevent data race conditions.
Cost-Limit Constraints: You can precisely control its boundary footprint by setting countLimit (maximum number of stored images) or totalCostLimit (maximum number of cumulative bytes). This lets you enforce a strict, predictable RAM budget for your grid thumbnail system.
No Disk Latency: Because it stores ready-to-render UIImage objects entirely in memory, fetching a thumbnail from the cache completely bypasses the local storage layer. This eliminates the CPU tax of constantly re-reading raw data blobs off disk every time a cell scrolls back onto the screen.
By querying a target layout asset through this loader layer, the memory demand per image drops from 48.7 MB to roughly 230 KB—an immediate reduction of over 99% per view node. This architecture ensures that your application scales predictably, maintaining a low memory baseline whether your lazy grids are loading 15 items or 110 items.


Comments